|
Housing Normality As soon as we can stabilize housing, all of our troubles will be solved. This is the mantra we hear night after night on CNBC. The chart below unmistakably paints an abnormal picture of home prices. Karl Case, an economics professor at Wellesley College whose name adorns the S&P Case-Shiller home-price indexes, has studied U.S. house prices going back to the 1890s. Over the long run, he says, home prices tend to increase on average at an inflation-adjusted rate of 2.5% to 3% a year, about the same as per capita income.
The American population has steadily increased from 100 million to 300 million over the last 120 years. Home prices gained at an uneven rate from 1890 until 2000. Then the combination of bubble boy Alan Greenspan, Harvard MBA George Bush, delusional home buyers, criminal investment bankers, pizza delivery boys turned mortgage brokers, and blind regulators led to the greatest bubble in history. Prices doubled in many places in six years versus a 15% expected historical return. Prices have now declined back within the range seen during the period from the 1970s through the 1990s. This is why the eternal optimists are proclaiming a housing bottom. These people don’t seem to understand the concept of averages. An average is created by prices being above average for a period of time and then below average for a period of time. The current downturn will over correct to the downside. The most respected housing expert on the planet, Robert Shiller, recently gave his opinion on the future of our housing market: “Even the federal government has projected price decreases through 2010. As a baseline, the stress tests recently performed on big banks included a total fall in housing prices of 41 percent from 2006 through 2010. Their “more adverse” forecast projected a drop of 48 percent — suggesting that important housing ratios, like price to rent, and price to construction cost — would fall to their lowest levels in 20 years. Long declines do happen with some regularity. And despite the uptick last week in pending home sales and recent improvement in consumer confidence, we still appear to be in a continuing price decline. After the bursting of the Japanese housing bubble in 1991, land prices in Japan’s major cities fell every single year for 15 consecutive years. Even if there is a quick end to the recession, the housing market’s poor performance may linger. After the last home price boom, which ended about the time of the 1990-91 recession, home prices did not start moving upward, even incrementally, until 1997.”
Residential investment and home improvement expenditures have averaged 1.07% of GDP over the last 50 years. This is the 4th time it has peaked above 1.2%. After the three previous peaks it bottomed below 1%. Based on history, it will bottom out at .8% in the middle of the next decade. This would be a reduction of $70 billion in housing investment from the peak. Great news for Home Depot and Lowes. A housing rebound is a virtual impossibility based on any honest assessment of the facts. Homeowners currently have the least amount of equity in their homes on record. Real-estate Web site Zillow.com said that overall, the number of borrowers who are underwater climbed to 20.4 million at the end of the first quarter from 16.3 million at the end of the fourth quarter. The latest figure represents 21.9% of all homeowners, according to Zillow, up from 17.6% in the fourth quarter and 14.3% in the third quarter. There are 75 million homes in the United States. One third of homeowners have no mortgage, so that means that 41% of all homeowners with a mortgage are underwater. With prices destined for another 10% to 20% drop, the number of underwater borrowers will reach 25 million. MORTGAGE DEBT
There are over 4 million homes for sale in the U.S. today. This is about one year’s worth of inventory at current sales levels. You can be sure that another one million people would love to sell their homes, but haven’t put their homes on the market. The shills touting their investments on CNBC every day fail to mention the approaching tsunami of Alt-A mortgage resets that will get under way in 2010 and not peak until 2013. These Alt-A mortgages are already defaulting at a 20% rate today. There are $2.4 trillion Alt-A loans outstanding. Alt-A mortgages are characterized by borrowers with less than full documentation, lower credit scores, higher loan-to-values, and more investment properties. There are more than 2 million Alt-A loans in the U.S. 28 percent of these loans are held by investors who don’t live in the properties they own. That includes interest-only home loans and pay-option adjustable rate mortgages. Option ARMs allow borrowers to pay less than they owe, with the rest added to the principal of the loan. When the debt exceeds a pre-set amount, or after a pre- determined time period has passed, the loan requires a bigger monthly payment. How can housing return to “normality” with this amount of still toxic debt in the system? It can’t and it won’t. ALT-A MORTGAGE RESETS
Mortgage delinquencies as a percentage of loans stayed between 2% and 3% from 1979 through 2007. I would categorize this as normal. The Mortgage Bankers Association just reported a delinquency rate of 9.12% on all mortgage loans, the highest since the MBA started keeping records in 1972. Also, the delinquency rate only includes late loans (30-days or more), but not loans in foreclosure. In the first quarter, the percentage of loans in foreclosure was 3.85%, an increase of 55 basis points from the prior quarter and 138 basis points from a year ago. Both the overall percentage and the quarter-to quarter increase are records. The combined percentage of loans in foreclosure and at least one payment late is 12.07%, another record. Delinquencies on subprime mortgage loans rose to 24.95% from 21.88% in the fourth quarter of 2008. Prime loan delinquencies rose to 6.06% from 5.06% one quarter ago, a significant and disturbing increase from a group of borrowers that aren’t expected to default.
With the 30-year mortgage rate approaching 5.7%, mortgage refinancing activity has plunged about 60% in the last two months. Mortgage applications for new home purchases collapsed at a 20% annual rate in May too. Normality in the mortgage market appears to be a few years away. MORTGAGE DELINQUENCIES AS A % of LOANS
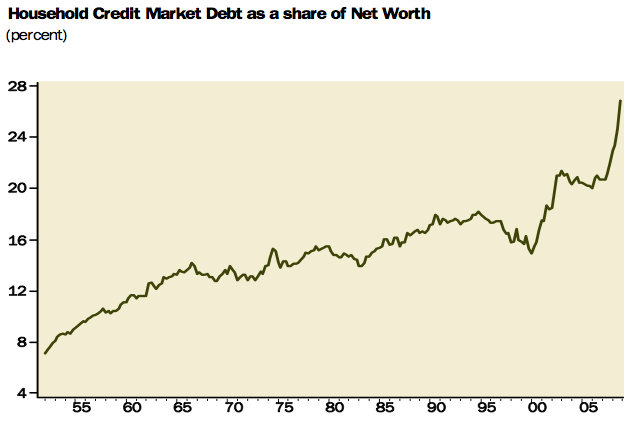
Household Normality “You can't drink yourself sober and you can't leverage your way out of excess leverage." Barry Ritholtz Barry is right, but it isn’t stopping the Obama administration from trying to solve our hangover with a lot more of the dog that bit ya. The current policy of borrowing in order to stimulate the economy is warped. Providing more easy credit so poor people can buy Mercedes SUVs will not solve our problems. The brilliant Doug Casey clearly understands the policy that should be in effect: “The way a society, like an individual, becomes wealthy is by producing more than it consumes. In other words, by saving, not borrowing. But you don’t become wealthy by spending and consuming; you become wealthy by producing and saving. Inflation encourages people to borrow, because they expect to pay the debt off with cheaper dollars. It encourages people to mortgage their future. The basic economic fallacy in this is that a high level of consumption is good. Well, consumption is neither good nor bad. The problem is the emphasis on consumption financed by debt -- which leads to the national bankruptcy we’re facing. It’s much healthier to have an emphasis on production, financed by savings.” Household credit market debt currently stands at $13.8 trillion, an all-time high. It has not fallen. From 1965 through 2000, it ranged from 14% to 17% of Household net worth. It currently stands at 27% of Household net worth, an all-time high. Is this normal or abnormal? At the end of 2008, household net worth totaled $51.5 trillion, down $11.2 trillion in one year. In order to get household debt as a percentage of net worth to a “normal” level of 16%, will require households to either reduce debt or increase savings by $5.6 trillion. I don’t think this will be done by next Wednesday. It will take a decade or more.
Source: Haver Analytics, Gluskin Sheff Famed investor Robert Rodriguez places the blame for our current debt induced collapse squarely at the feet of our government. “The regulatory agencies and the federal government were complicit in laying the groundwork that allowed many of these credit excesses to develop prior to this economic crisis. Had they done their job effectively, the economy would not have been pushed to the brink of collapse. I fundamentally disagree with these “rescue” programs since we believe our impaired financial system is being distorted by protecting inefficient and questionable business enterprises. Misguided measures to re-stimulate consumer borrowing, beyond just getting the system functioning, are highly questionable. This net worth destruction is the most severe since the Great Depression. We have a news flash for the government, creating new credit programs for a consumer who was spending almost $1.1 trillion more than they were earning in spendable income, according to MacroMaven’s estimate, will be a non-starter. More leverage is not what they need. Encouraging the consumer to take on more debt is like trying to help a recovering heroin addict lessen his pain by providing him with more heroin.” If there is one chart that tells the tale of the U.S. economic demise, it is the graphic below. It illustrates the transformation of a country that saved and invested to a country that borrowed and spent. In 1981 consumer expenditures accounted for 62% of GDP and private investment accounted for 19% of GDP. Consumer expenditures soared to 70% of GDP while private investment plunged to 11% of GDP. The American economy needs to revert back to the healthier percentages of 1981. Essentially, American households need to spend $1 trillion less per year and use this money to pay down debt and increase savings.
The Personal Savings rate as a percentage of disposable income dropped below 0% in 2006. Over the last 50 years, the average has been 7.2%. The rate has been below this average since 1992. The rate has recently reached 4% as delusional Boomers are beginning to grasp their bleak future. Boomers always seem to go too far. They will eventually wear the badge of frugality as proudly as they wore the badge of over-consumption. Robert Rodriguez sees an 8% savings rate on the horizon. “A dramatic rise in the U.S. personal savings rate will be required to begin the mending process of the consumer’s balance sheet. I expect the U.S. personal savings rate will rise from 2% to 8% this year and remain at an elevated level for the foreseeable future. This process should increase savings by approximately $650 billion annually. An increase of this magnitude, in such a brief period, is unprecedented, other than during WW2, when it rose from 12% to 24% between 1941 and 1942. Assuming some earnings on this incremental savings and a partial recovery in the stock and real-estate markets, it will likely take ten years for the consumer’s net worth to return to its pre-crisis level.”
Anyone anticipating a consumer led recovery is counting on consumers who have been whacked in the head with a 2 by 4 to stagger to their feet and say, thank you sir may I have another? Even with interest rates at extremely low levels, household debt service is 14% of disposable income, versus the 30 year average of 12.1%. As interest rates rise, this burden will break the consumer’s back. The only way to avoid this fate is a substantial pay down of debt. The only difficulty with paying down debt is you need cash to pay it down. For decades, from the 1940s until 2000, Americans were cautious about debt. They always had an emergency fund for those unexpected expenses that always pop up. If your washer broke, a TV crapped out, or your lawn mower stopped working you had the cash on hand to buy a new one. This attitude became passé as we entered a new century. Who needed cash when you received three credit card offers per day in the mail? Today, not only do most Americans not have cash to cover unexpected expenses, they don’t have cash for milk and bread. A vast swath of America pays for their cigarettes, lunch meat, and morning coffee with a credit card. This has resulted in a net $4 trillion deficit of household cash versus household liabilities. Is this normal or abnormal? Now that Americans have used up all the equity in their houses, and some, they have turned to their last resort – credit cards. The government has handed billions of taxpayer funds to the biggest credit card issuers in the world (Bank of America, JP Morgan, Citicorp, Wells Fargo, Capital One, and American Express) so they will continue to give grossly overly indebted Americans more rope to hang themselves. This ridiculous solution will destroy the National balance sheet and the people who continue to spend more than they make. We are running up the National credit card balance and passing the bill to future generations. Credit card delinquencies are already at the highest level in history. With 25 million (U6 – 16.4%) people unemployed, out of a work force of 155 million, another 2 to 3 million likely to lose their jobs, house prices still falling, and foreclosures likely to top 2 million in 2009, credit card delinquencies will surge to unprecedented levels in 2010. Does anyone really believe our biggest banks are solvent?
The New Normal “Loading up the nation with debt and leaving it for the following generations to pay is morally irresponsible. To preserve independence, we must not let our rulers load us with perpetual debt.” Thomas Jefferson The last three decades have not been normal. They’ve been Abby Normal. When a society chooses to spend more than it produces, the only people who get rich are the bankers lending out the money. For a society to progress, its citizens must save more than they spend. The excess savings can then be utilized to invest in long-term assets that will increase the wealth of the nation. A society needs to produce more than it consumes, or it will eventually wither away. Debt keeps Americans enslaved to the corrupt bankers and clueless government bureaucrats who run our fair country. "Debt is an ingenious substitute for the chain and whip of the slave driver." Ambrose Bierce When this debt binge began in 1982, the profits of financial companies accounted for 7% of all U.S. company profits. At the peak in 2006, they accounted for more than 30% of all U.S. company profits. This is why the money managers own the yachts, not the customers. The banking industry, backed by its sugar daddy the Federal Reserve, has enslaved the most of America in their web of debt. They have sucked the vitality and creativity from the nation through the distribution of easy credit. In the last nine years these whoring bankers went completely mad in their greed induced search for outrageous levels of compensation by granting credit to anyone with a breath and creating fraudulent products to perpetuate ever increasing levels of debt. When this blew up in their faces these banks should have gone bankrupt and many bank executives should have gone to jail. Instead, Dr. John Hussman explains what has happened:
“Rather than following policies that would have allowed for a sustainable recovery, our policy makers opted for a stunningly unethical strategy of making bank bondholders whole with well over a trillion dollars in public funds, watering down accounting rules to allow banks to go quietly insolvent while reporting encouraging “operating profits,” looking beyond the continued shortfall of loan loss reserves in relation to loan defaults, and doing nothing meaningful with regard to foreclosures, whose rates continue to soar and which face a fresh wave later this year and well into 2010 and 2011. These policy responses have more than doubled the U.S. monetary base within a period of months, added a trillion more in outstanding Treasury debt, and virtually assure that the value of those government liabilities will be re-priced in relation to goods and services over the coming decade. A range of different methodologies suggest a doubling in U.S. consumer prices over the coming decade, though with the majority of this pressure occurring 3-4 years out and beyond.” |
||
![[robert-shiller-graph.png]](http://theburningplatform.com/uploads/image/clip_image005%286%29.jpg)

![[RIQ12009HomeImprovement.jpg]](http://theburningplatform.com/uploads/image/clip_image008%286%29.jpg)

![[mm8.png]](http://theburningplatform.com/uploads/image/clip_image012%288%29.jpg)


| © 2026 - Information Directory |


|